Indicators for more flexible and relevant dashboards!

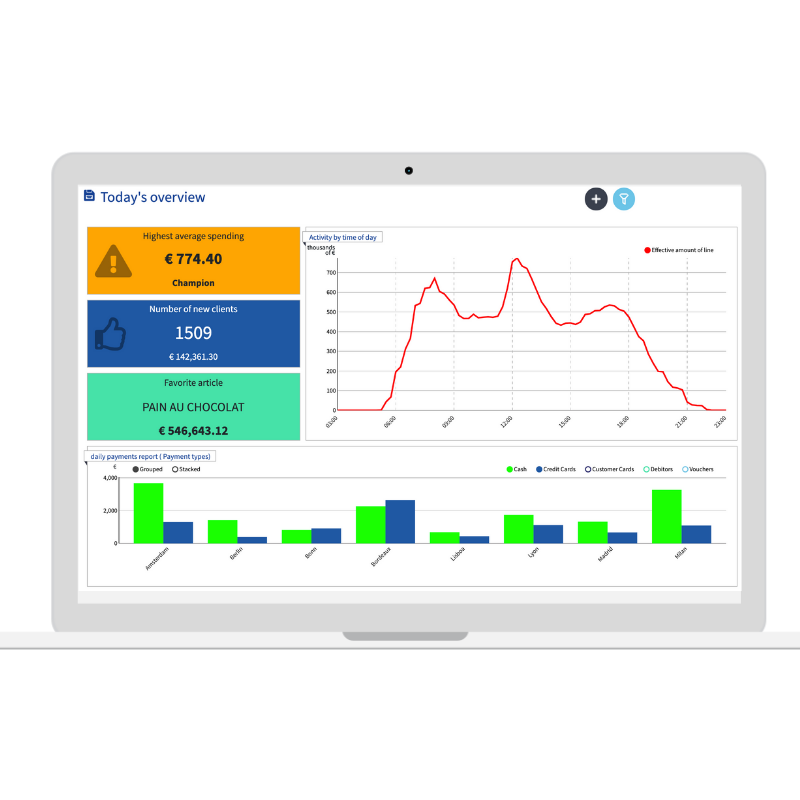
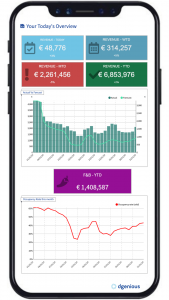
Indicators are suited to highlight 1 or 2 key figures, and possibly as a link to drill down into another report or dashboard. They are highly customizable in terms of font, colors and image. The screen captures below give an idea of how they can be used.

Related posts

You want to develop your Franchise in 2021? Adopt optimal data management!

Here are our 4 tips to make 2021 a pivotal year in the growth of your franchise.

With dgenious ‘Tasks’, you can now send files to a sftp server.

This new feature completes dgenious’ wide range of options for producing and consuming data.

What is Point of Sale Analytics?

Discover how point of sale analytics can help you make greater strides in your business’ growth than ever.

Subscribe to our newsletter!

Keep up to date with our latest news, projects, testimonials, …

Newsletter

Test your Data Maturity with our exclusive quiz!

Answer our 6 questions and receive our recommendations to become a more knowledgeable businessman/woman thanks to a better data expertise!

QUIZ