Investing in the stock market naturally implies a rigorous follow-up of the market evolution. This precise monitoring of the stock market price is done in real-time to react as quickly as possible to positive and negative fluctuations in shares and other securities. Knowing the news to react to stock market trends in real-time seems to you to be an implacable logic. But what about data analysis of your sales network?
What do you think about integrating real-time into your data analysis?
In this article, we discuss the notion of real-time in the analysis of your business performance figures. Indeed, this notion of simultaneity, although commonplace in the stock market language, is not yet used in retail data analysis! Many retail managers still declare that they don’t need real-time because they compile the figures once a week and that’s enough for them. Do you also share this feeling?
It is then interesting to draw a parallel with the monitoring of the stock market price. Would you dare to rely on weekly monitoring of the market evolution to manage your stock market investments? The answer is certainly no… Just like stock market monitoring, real-time data analysis is essential to be able to react quickly and well, to listen to your customers’ consumption trends and respond quickly to their expectations. Acting precisely where you are going to get real results, this is one of the promises of real-time now easily accessible
Be able to react fast to current fluctuations and trends.

The stock market refers to all markets and exchanges where regular buying and selling activities take place. These financial activities are conducted through formal institutionalized exchanges that operate under a defined set of regulations. Stock market investments are subject to fluctuations in the financial markets, both up and down. Past performance is no guarantee of future performance. Therefore, real-time monitoring is of utmost importance. Real-time monitoring of stock prices involves the use of applications and tools that track and record continuous snapshots of the performance of your shares.
In fact, several websites and platforms offering real-time, intra-day stock charting capabilities are available.
Traders can create watch lists and alerts. They can also see which stocks are hot. In addition, they can even trade directly from the charts by connecting with a broker. For example, you can also use the strategy tester to test an integrated strategy for a particular stock and time period. This type of monitoring platform offers a very complete list of markets, indices, and economic data for example.
In data monitoring, this type of business platform monitoring also exists to follow the trends, the evolution of the turnover and the average basket, as well as the consumption habits of the customers in the whole network of franchisees. Even if you set a basic objective by comparing it with the same time T as the previous year, it is never said that a commercial action will work in the same way, because consumption habits and trends are relatively changeable and subject to current events. For this reason, it is important to be flexible and to collect data in real-time, in an automatic way with a tool that will make your job easier.
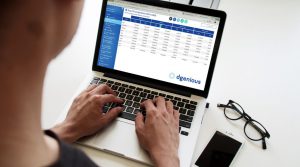
In addition to being a disruptive technology, dgenious is present at the most crucial moment for you: the moment your customers pay. It offers unparalleled ease of use, automates the sharing of your custom reports, and gives you the ability to collect all the data you need without having to rely on your IT team or an external consultant.
- With dgenious, a simple connection to your cash register or payment systems is enough to have all the information immediately available to you.
- You can see in real-time, via your Iphone, the figures of the promotion launched this morning by point of sale. You can see whether identified customers are buying more or less than unidentified customers. Or even which promotional item is selling the most, per store and per hour.
- Missing an analysis you need? Just log in to dgenious and do the research yourself!
Set your business goals for effective real-time monitoring.

Let’s continue with the parallels between stock market monitoring and data monitoring because if you still have any doubts, there is really no lack of points of comparison!
In the stock market, it is necessary to set objectives to closely monitor key points according to periods, trends and events in real-time that could modify the evolution of the stock market and, consequently, cause an upward or downward fluctuation of the shares.
In data monitoring, it is the same thing; for optimal analysis, it is essential to determine the KPI’s to follow to measure the evolution of your business and evaluate if the objectives are reached or not. We talked about this in one of our previous articles: “Measure the evolution of your performance with key performance indicators (KPIs)”
Receiving results in real-time for each of the KPI’s determined means having the possibility to act immediately, whether it be in the stock market or for the evolution of the performance of your sales network. The notion of immediacy is once again crucial here.
With a monitoring platform like dgenious, the panel of key performance indicators is unlimited and very simple to set up. Receive results that precisely meet your expectations and are constantly updated.
So, are you ready to manage your business monitoring as accurately and efficiently as the stock market?


