You have always dreamed of achieving perfect mastery of the data management of your company and/or network of points of sale. But this seems like a utopia to you. But don’t be mistaken! This year, achieve your wildest goals thanks to the key performance indicators. Refine your strategy by highlighting your strong points and correcting your weak points, thanks to an in-depth and cross-dimensional knowledge of your data.
Here is a first selection of key indicators that are essential to boost your organisation’s performance. But you should know that we have not finished surprising you. With dgenious, the possibilities for analysis are now infinite and instantaneous.
Why use key performance indicators?

Key performance indicators give meaning to all the data generated by your business or franchise network.
Indeed, they correlate your data together in order to deepen the meaning of your figures. All available data is taken into account and placed in a single, coherent scenario. You benefit from a precise and unified overview, allowing you to have an objective view of the reality of your business. Whatever your sector.
Related article: Restaurant Analytics Explained
Thanks to key indicators you are able to make better strategic and commercial decisions. Even more, you finally exploit the real potential of your data to understand how and where to redirect your efforts. Examples of results?
- Increased customer loyalty
- Increase the productivity of your network of points of sale
- Improving your products and services
- Increase the profitability of your company
Discover the testimony of Jean-David Couderc, COO for Färm and fervent user of key indicators.
Ready to upgrade your level of analysis using our fine selection of key performance indicators?
In our previous article, we gave you our advice for 2021 to develop your franchise. Amongst this advice, we encourage you to increase the relationship you have with your consumers in order to meet their needs and, ultimately, to make them loyal to your offer.
In order to achieve this objective, it is essential that you have a thorough understanding of the behaviour of your prospects and current consumers. Knowing the age, gender, mobility,…but also the frequency of purchase, the average basket, the products purchased, the preferred sales channel, etc… Cherry on the cake, being able to compare the figures of one shop with those of your entire network. To help you do this: key indicators.
Our suggestion of key indicators to monitor consumer behaviour.
Here is a set of indicators that will help you see more clearly in your next data analysis. This list is not exhaustive, but it is an excellent basis for developing your reports. Because, don’t forget, with dgenious, the creation of indicators is infinite and customizable for each of our users.
- Key Indicator 1:The list of customers who bought an item last month and not yet this month.
- Key Indicator 2: The list of customers born next month and who have not been in one of your shops for more than 3 months.
- Key indicator 3: The list of customers who bought a pair of pink gloves without the matching cap. Thorough this is the most sold pair of gloves with this product.
- Key indicator 4: The list of customers with a distinction between the percentage of online and offline purchases.
- Key indicator 5: The list of customers who bought a sandwich last week, but not yet this week and who were born in January.
Do you find these indicators complex to set up? Rest assured, you can do it very easily thanks to our data management system.
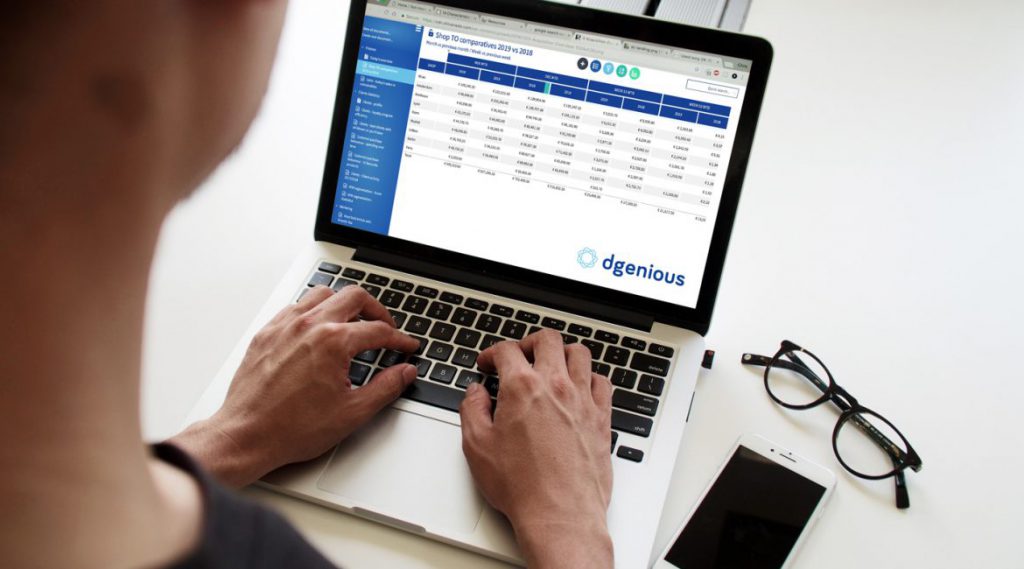
To give you an overview, here is a simulation of the setting of the key performance indicator, number 5:
Need a key indicator for monitoring purchase frequency?

- Key indicator: The number of sales per hour of the day and per point of sale.
In 2021, it is imperative to be able to make an accurate and real-time assessment of the frequency of purchases hour by hour. To do this, we advise you to set up a key indicator that will monitor your results in real-time, per shop, also for the webshop and that will compare the entire network of points of sale simultaneously.
This granularity of analysis will allow you to differentiate between each shop and pinpoint exactly where the performance gaps lie. The objectives are targeted, the measures applied are personalised and much more effective.
Would you like to specify your logistics report?

With the pandemic, the difficulty of stock management has been pointed out. It is therefore essential to find the right balance between stock shortages and overstocking in order to ensure optimal flow management.
As of now, we invite you to set up an additional performance indicator:
- Key indicator: real-time monitoring of your stocks per article compared with real time sales.
As you will have understood, we like precision. This indicator will therefore have to monitor stocks in real-time per shop, per distribution channel and for the entire network.
This article has enlightened you but you don’t know how to be effective? Don’t panic, with dgenious it’s very easy! No need to change your existing systems! In just a few minutes, you create and automate your report in dgenious.
No IT knowledge is required. You can also share it with all users in your organisation. Each user sees the report according to their own permissions.
So? Ready to be a data pro in 2021 thanks to your new Key Performance Indicators?


